PROBLEM
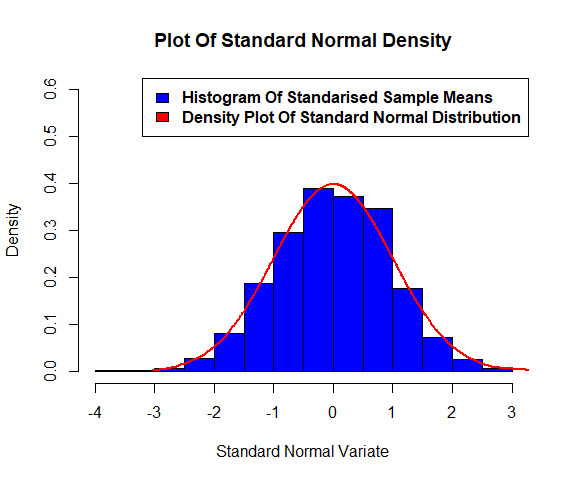
Draw 1000 random samples of size 100 each from normal distribution with parameters μ = 5 and σ = 3. Compute sample mean for each sample. Plot histogram of standardized sample means. Superimpose the standard normal curve on the histogram.
Theory-
The density of the normal distribution is given by-
f(x) = 1/(√(2 π) σ) e^-((x – μ)^2/(2 σ^2)) , when we take µ=0 and σ=1, the normal distribution is said to be standard normal distribution.
where μ is the mean of the distribution and σ the standard deviation.
R Code-
#Variable To store Sample Means
SampListMeans=c()

#Calculating Sample Means And Standarised Sample Means
StdSampMeans=c()
for(i in 1:N)
{
SampList[[i]]=rnorm(n,5,3)
SampListMeans[i]=mean(SampList[[i]])
StdSampMeans[i]=(SampListMeans[i]-5)/(3/(n^0.5))
}

#Histogram Of Standarised Sample Means
hist(StdSampMeans,freq=F,ylim=c(0,0.6),border="black",col="blue",
xlab="Standard Normal Variate",main="Plot Of Standard Normal Density")

#Generating Data From Standard Normal Distribution
y=rnorm(N,0,1)
y1=sort(y)

#Plot Of Standard Normal Density
lines(y1,dnorm(y1,0,1),type="l",col="red",lwd=2)

#Command to plot legends
legend("topright",legend=c(expression(bold("Histogram Of Standarised Sample Means")),
expression(bold("Density Plot Of Standard Normal Distribution"))),fill=c("Blue","red"))
cat("Means Of The Different Samples are-\n")
SampListMeans
Output Graph Of Normal Distribution-