PROBLEM
An engineer, observing a nuclear reaction, measures time intervals between emissions of beta particles . Following are inter arrival times:
0.894,0.235,0.071,0.459,0.1,0.991,0.424,0.159,0.431,0.919,0.061,0.216,0.082,
0.092,0.9,0.186,0.579,1.653,0.83,0.093,0.311,0.429,2.01,1.718,0.041,0.817,
0.612,0.158,0.099,0.712,2.267,0.143,0.527,0.162,0.994,0.091,0.055,1.033,0.076,
0.149,0.139,0.752,2.863,0.107,0.866,0.083,0.188,0.365,0.278,0.054.
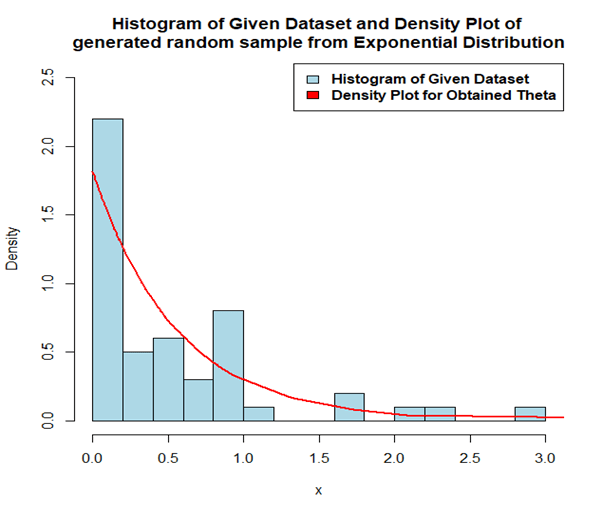
Find the mean for the above data set. Construct a histogram-density and superimpose exponential density function with suitable value of the parameter as judged from the observations.
Theory-
The exponential distribution with rate λ has density
f(x) = λ {e}^{- λ x} ; for x ≥ 0.
And expectation (mean) of x is-
E[x] = 1/ λ ; and Rate (λ) = 1/E[x]
R Code-
#Command to remove previous objects
rm(list=ls())

#given dataset
x=c(0.894,0.235,0.071,0.459,0.1,0.991,0.424,0.159,0.431,0.919,0.061,0.216,0.082,0.092,0.9,
0.186,0.579,1.653,0.83,0.093,0.311,0.429,2.01,1.718,0.041,0.817,0.612,0.158,0.099,0.712,
2.267,0.143,0.527,0.162,0.994,0.091,0.055,1.033,0.076,0.149,0.139,0.752,2.863,0.107,
0.866,0.083,0.188,0.365,0.278,0.054)

#Number of values in dataset
length(x)

#summing the values of dataset
sum=0
for(i in 1:length(x))
{
sum=sum+x[i]
}

#Mean of the dataset
Mean=sum/length(x)
cat("Mean time intervals between emissions of beta particles is: ",Mean,".\n")

#calculating parameter theta
theta=1/Mean
theta

#Generating random sample from exp. dist. for obtained theta
RandSamp=rexp(length(x),theta)

#generated random sample is-
RandSamp

#Histogram of given dataset-
hist(x,prob=T,xlim=c(0,3),ylim=c(0,2.5),border="black",col="lightblue",breaks=12,
main = paste("Histogram of Given Dataset and Density Plot of
generated random sample from Exponential Distribution"))

#exponential density plot of obtained random sample-
lines(sort(RandSamp),dexp(sort(RandSamp),theta),col="red",lwd=2)

#Drawing legend for the plot
legend("topright",legend=c(expression(bold("Histogram of Given Dataset")),
expression(bold("Density Plot for Obtained Theta")))
,fill=c("lightblue","red"))
Output On R Console-
> #Command to remove previous objects
> rm(list=ls())
>
> #given dataset
> x=c(0.894,0.235,0.071,0.459,0.1,0.991,0.424,0.159,0.431,0.919,0.061,0.216,0.082,0.092,0.9,
+ 0.186,0.579,1.653,0.83,0.093,0.311,0.429,2.01,1.718,0.041,0.817,0.612,0.158,0.099,0.712,
+ 2.267,0.143,0.527,0.162,0.994,0.091,0.055,1.033,0.076,0.149,0.139,0.752,2.863,0.107,
+ 0.866,0.083,0.188,0.365,0.278,0.054)
>
> #Number of values in dataset
> length(x)
[1] 50
>
> #summing the values of dataset
> sum=0
> for(i in 1:length(x))
+ {
+ sum=sum+x[i]
+ }
>
> #Mean of the dataset
> Mean=sum/length(x)
> cat("Mean time intervals between emissions of beta particles is: ",Mean,".\n")
Mean time intervals between emissions of beta particles is:  0.54948 .
>
> #calculating parameter theta
> theta=1/Mean
> theta
[1] 1.819902
>
> #Generating random sample from exp. dist. for obtained theta
> RandSamp=rexp(length(x),theta)
>
> #generated random sample is-
> RandSamp
 [1] 0.017389939 0.061081150 0.522417785 0.009034097 0.180998964 0.072922095
 [7] 0.694610228 0.442274739 0.452234182 0.399031298 0.145987654 0.485601632
[13] 0.353451939 0.044372730 0.164781404 0.434502191 0.484333659 1.291359014
[19] 0.153015701 0.696088087 0.311519217 0.479048669 1.725772484 0.336776049
[25] 0.830783240 0.826667288 0.019506458 0.001262748 0.297321332 0.325813754
[31] 0.962899651 0.063547690 0.080611930 2.081955145 1.330780813 0.176939231
[37] 0.462374813 0.791711380 0.029902847 0.022886135 0.291804393 0.178261146
[43] 0.925569119 0.015704042 4.636350411 0.219895864 0.017399201 0.103204971
[49] 0.007181274 0.231915795
>
> #Histogram of given dataset-
> hist(x,prob=T,xlim=c(0,3),ylim=c(0,2.5),border="black",col="lightblue",breaks=12,
+ main = paste("Histogram of Given Dataset and Density Plot of
+ generated random sample from Exponential Distribution"))
>
> #exponential density plot of obtained random sample-
> lines(sort(RandSamp),dexp(sort(RandSamp),theta),col="red",lwd=2)
>
> #Drawing legend for the plot
> legend("topright",legend=c(expression(bold("Histogram of Given Dataset")),
+ expression(bold("Density Plot for Obtained Theta")))
+ ,fill=c("lightblue","red"))
Output Graph On R Console-