R Code- Part-III
#Plot of Empirical And Estimated Survival Function
plot(sort(x),EmpSurFun,type="l",xlim=c(0,2500),xlab="Time",ylab=
"Survival Function",main="Plot Of Empirical Survival Function And
Estimated Survival Function",col="black",lwd=2)
lines(sort(RandSamp),EstSurFun,type="l",col="red",lwd=2)

#Command to create legend for the above plot
legend("topright",legend=c(expression(bold("empirical survival function.")),
expression(bold("estimated survival function."))),fill=c("black","red"))
Output Graph-
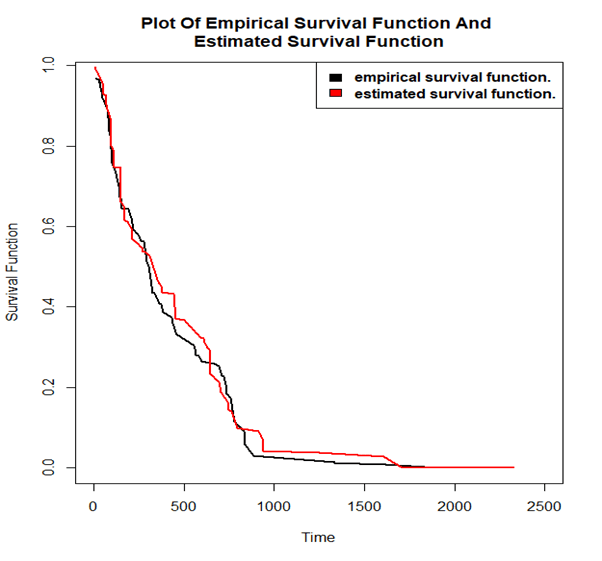
Conclusion-
From the above plot we can observe that both the survival function from the given dataset as well as the estimated exponential survival function approximately follow the same path. Hence we can say the exponential model is adequate in explaining the given dataset in exponential model.

Hello! This post couldn’t be written any better! Reading through this post reminds me of my good old room mate! He always kept chatting about this. I will forward this page to him. Pretty sure he will have a good read. Thanks for sharing!
LikeLiked by 1 person